If you want to know about the climate and elements of climate or site climate or climatic zones in India, please click the link.
Climate and thermal comfort are two closely related concepts that have a significant impact on human health, productivity, and overall well-being.
Climate refers to the long-term weather patterns and conditions of a specific region, including temperature, humidity, rainfall, and wind patterns. The climate of a particular region can have a significant impact on the local ecosystem, including plant and animal life, as well as human communities that inhabit the area.
Thermal comfort, on the other hand, is the subjective experience of feeling comfortable in a particular environment, based on a range of factors, including air temperature, humidity, air movement, and personal clothing. Achieving thermal comfort is essential to maintaining a healthy and productive indoor environment, as both excessive heat and cold can have negative impacts on human health and productivity.
1) Thermal comfort factors

i) Bio-climatic design
- The task of the designer is to create the best possible indoor climate (it is not feasible to regulate out-door conditions)
- The challenge for the designer is to strive towards the optimum of total comfort, defined as “the sensation of complete physical and mental well-being.”
- Human thermal comfort is the dominant problem.
- “Thermal comfort is that condition of mind that expresses satisfaction with the thermal environment” (ASHRAE 2001)
- Physiological responses to specific climatic conditions can be verified by controlled experiments
- Establishing thermal comfort criteria dates back in Europe in the beginning of the 19th century.
2) Thermal comfort
Physiological factors
- Metabolic rate (level of activity)
- Clothing
- Environmental factors –air temperature, humidity, air movement and radiation
Other factors
- Living habits
- Acclimatisation
- Body shape
- Subcutaneous fat
- Age
- Gender
- Food
- Drink
The body’s heat production
- Of all the energy produced in the body, only about 20% is utilized, the remaining 80% is ‘surplus’ heat.
- The human body constantly generates excess heat, but at varying rate, which must be dissipated.
- The amount of heat generation depends on activity level and whether the heat generated is sensible or latent. The unit of metabolic rate is the met.
- One met represents the average heat produced by a sedentary man, i.e., 100 W at 58.2 W/m2 (ASHRAE 2001). Heavy work is rated up to at 7.0 met.
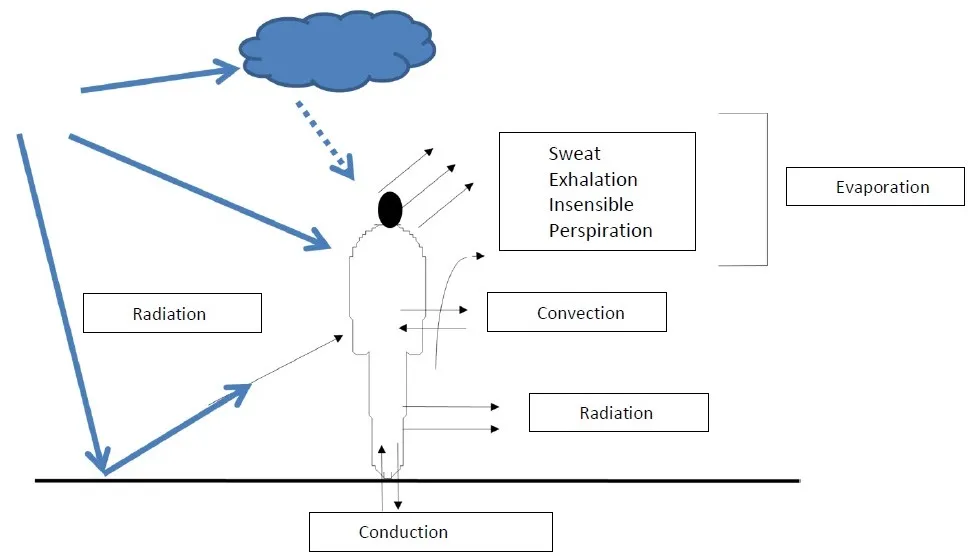
Regulatory mechanism
- Thermal balance exists when external heat gains and heat produced by the body are fully dissipated to the environment.
- The body’s heat balance can be expressed as equation Met-Evp ± Cnd ± Cnv ± Rad = ΔS(W)
Met = metabolism (basal and muscular)
Evp= evaporation (of moisture and sweat)
Cnd=conduction (contact with warm or cold bodies)
Cnv= convection (if the air is warmer or cooler than the skin)
Rad= radiation (from the sun, the sky and hot bodies or to night sky and cold surface)
ΔS(W)= change in heat stored if + body temperature increases, if – body temperature decreases
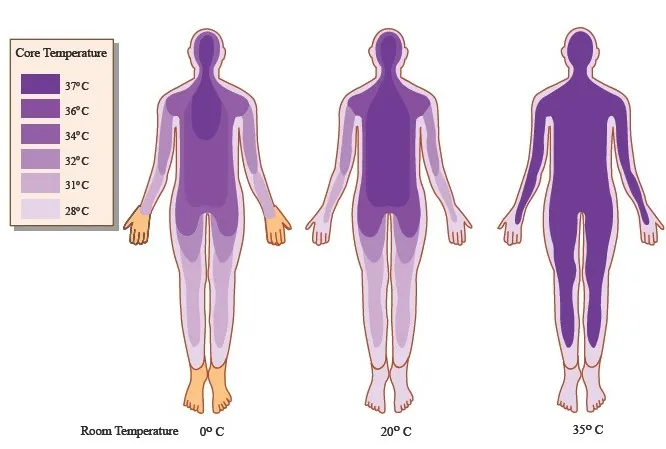
Vaso-motor adjustments
Vasodilation
- When body temperature increases vasodilation increases the blood flow to the skin surface, this elevates the skin temperature, to increase heat dissipation
Vasoconstriction
- When body temperature falls, vasoconstriction reduces the blood flow to the skin, to conserve the body heat
i) Basic human requirements
Other adjustments
- When vaso-motor adjustments cannot restore the balance, in an overheated situation sweating will provide an increased evaporative cooling, or in an underheated situation shivering will increase the muscular heat production. When these mechanisms
- While inadequate heat dissipation leads inevitable body heating – hyperthermia, excessive heat loss causes inevitable body cooling – hypothermia.
- Clothing is one of the dominant factors affecting heat dissipation. A unit has been advised for level of clothing, named the clo. 1 clo is the insulating value of a normal business suit, with cotton underwear. The clothing may range from 0 to more than 3.5 clo.
ii) Environmental Factors
- The various heat exchange processes at the body surface are influenced by a number of environmental factors; although these environmental factors vary independently of each other, the sensation of comfort or discomfort depends on the simultaneous effect of all these. Four basic environmental factors can be identified:
- Air temperature- the most important factor
- Humidity- only when extremely high (12 g/kg) or low (4 g/kg)
- air movement
- radiation
Quantifying comfort
- Initially Olgyay and Olgyay (1963) recommended 70ºF as the limit of comfort for latitude 40ºN and for other latitudes it should be increased by 3/4ºF for every decrease of 5º latitude.
- Thermal Indices- integrated effect of two or more environmental factors- air temperature, relative humidity, radiation, wind velocity and non environmental factors- level of activity, clothing, acclimatization
- Constancy or static model
- Adaptive model
iv) Bioclimatic chart
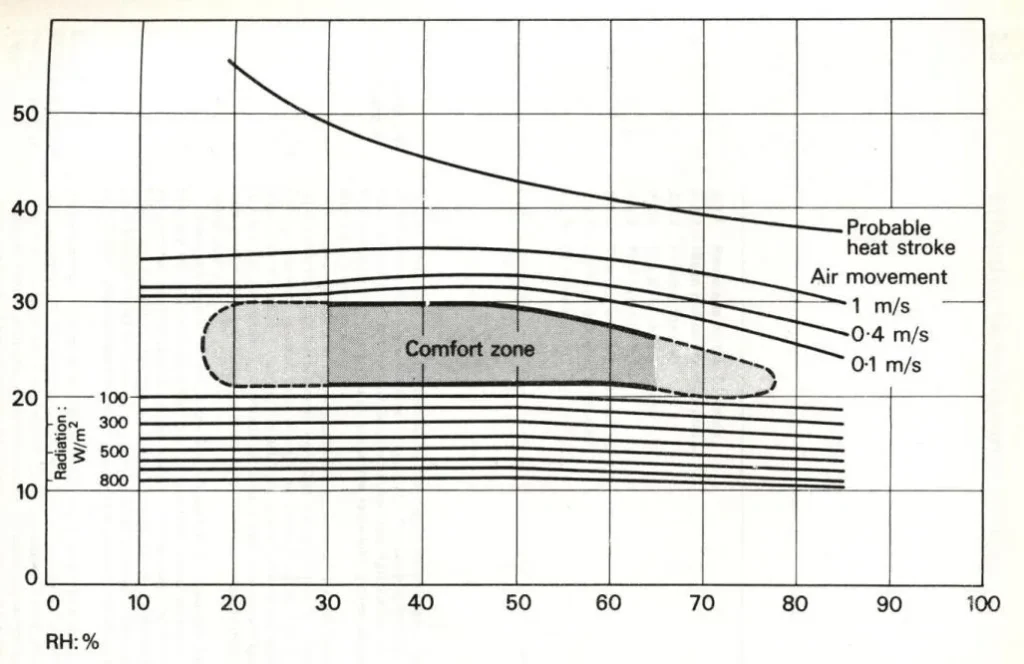
- For men at sedentary work – wearing 1 clo. Clothing – in warm climate V. Olgyay 1963, Design with climate, Princeton University Press.
v) Thermal index
- Many attempts have been made to integrate the effect of two or more environmental factors and to express the thermal response in terms of the integrated parameter. Such a combination of influencing environmental factors into a single parameter is called ‘Thermal Index’.
- Empirical indices: those developed purely from field experiments under defined environmental conditions
- Analytical indices: those produced by rational analysis of the thermal exchanges with the environment, i.e. heat flow paths from metabolic heat production to the environment and resistances to such flows.
3) Effective temperature (ET)
- Developed at ASHVE Pittsburgh research laboratories. It is defined as the temperature of a still, saturated atmosphere, which would, in the absence of radiation, produce the same effect as the atmosphere in question. It is represented by a set of equal comfort lines drawn on the psychrometric chart.
- Factors: Air Temperature, Humidity
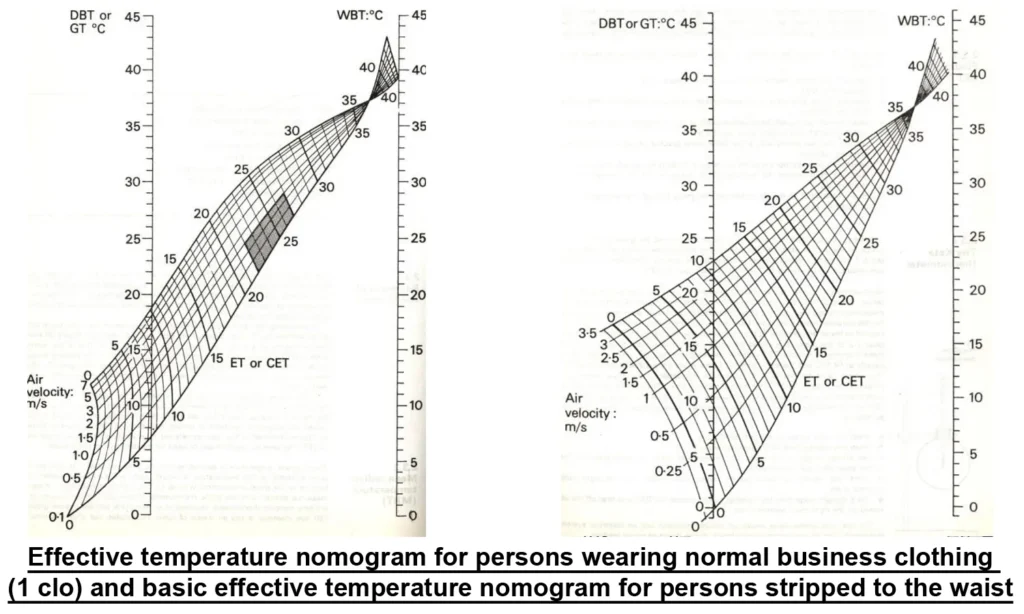
4) Corrected effective temperature
- A nomogram representation of ET index which included air velocity effects and showed that over about 100ºF (37.8ºC) air movement increases the thermal load (hence the reversal of the air velocity lines).
- Later Vernon (1932) included the effect of radiation by substituting globe temperature values for the dry bulb temperature scale.
- There are two nomograms: for people wearing 1 clo clothing (normal scale) and for people stripped to the waist (basic scale).
- Factors: Air Temperature, Humidity, Air velocity, Radiation, Clothing
i) Effective temperature (ET*)
- ET* is the most common environmental index and has the widest range of application.
- It is defined as the temperature (DBT) of a uniform enclosure at 50% relative humidity, which would produce the same net heat exchange by radiation, convection and evaporation as the environment in question.
- Factors: Air temperature, Humidity, Radiation, Clothing, Activity
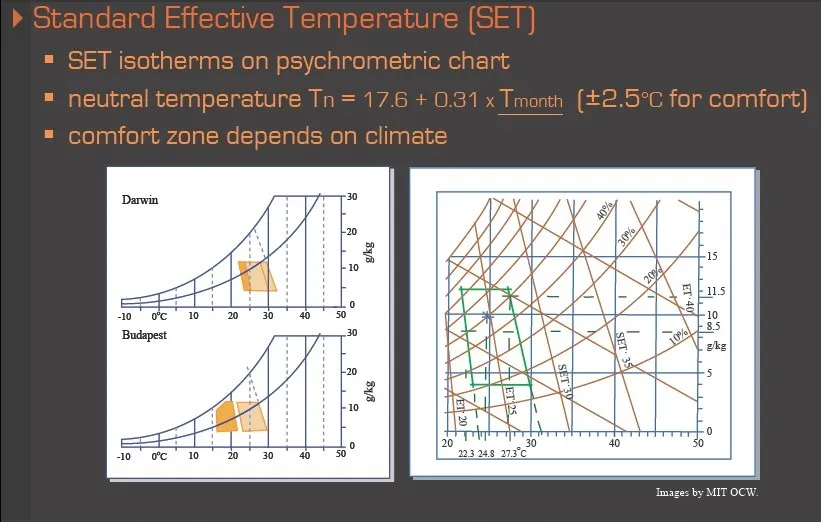
ii) Standard Effective temperature
- It is further development of ET* which allows for the variation of atmospheric pressure and extends the range of other variables.
- This is defined as “the temperature of a uniform enclosure at 50% RH, in which the mean body temperature of a sedentary subject (1.1 met), wearing 0.6 clo, in still air (< 0.15 m/s) at sea level is the same as the actual environment.”
- Factors: Air temperature, Humidity, Radiation, Clothing, Activity
5) Constancy or static model
- This is the term applied to analytical models developed and verified by laboratory tests. According to such models the preferred temperature that people choose for comfort under like conditions of clothing, activity, humidity, and air movement are similar throughout the world irrespective of variations in regional climate conditions, living conditions, and cultures
- The ‘two-node’ model of J. B. Pierce Laboratories (New Haven). This treats the heat transfer from the body core to the skin, then from the skin to the environment. This is the basis of the ET* and SET indices, adopted by ASHRAE comfort standard 55-1995.
- Fanger’s ‘comfort equation’, it is adopted by ISO 7730:1994. It is actually a heat balance equation, arranged to give a zero-storage component, which will be related to comfort through the Predicted Mean Vote (PMV) method. Predicted Mean Vote PMV is based on heat balance equations for the human body and is an index that predicts the mean vote of a large group of people on a 7-point thermal sensation scale. This scale reads from -3 (feeling cold) to +3 (feeling hot).
6) Adaptive model
- Thermal neutrality for a person is defined as a condition in which he or she prefers neither a higher nor a lower ambient temperature level. Thermal neutrality is a necessary condition for a person to attain thermal comfort.
- Auliciems formulated an adaptive, (psycho-physiological), an empirical model of thermal perception. This model relates people’s vote to some measurable environmental factors.
- Auliciems reported the strong correlations between thermal neutrality and mean monthly outdoor DBT and expressed by the equation of the regression of neutrality, tn, upon the mean monthly outdoor temperature, tm as follows:
tn = 17.6 + 0.31 . tm
- Auliciems states that it is possible to determine neutralities for all parts of the world within the range 17-31ºC. The neutrality limits given by Auliciems are : 18 < tn < 28ºC
- A study by Nicol and Roaf in Pakistan, the regression equation was found to be, tn = 17.0 + 0.38 . Tm
- An ASHRAE sponsored study on adaptive models compiled an extensive database from past field studies to study, develop, and test adaptive models.
- The adaptive models are useful to specify building temperatures set points throughout the year.
- In general, the value of using an adaptive model to specify set points or guide temperature control strategies is likely to increase with the freedom that occupants are given to adapt (e.g. by having flexible working hours, locations, or dress codes).
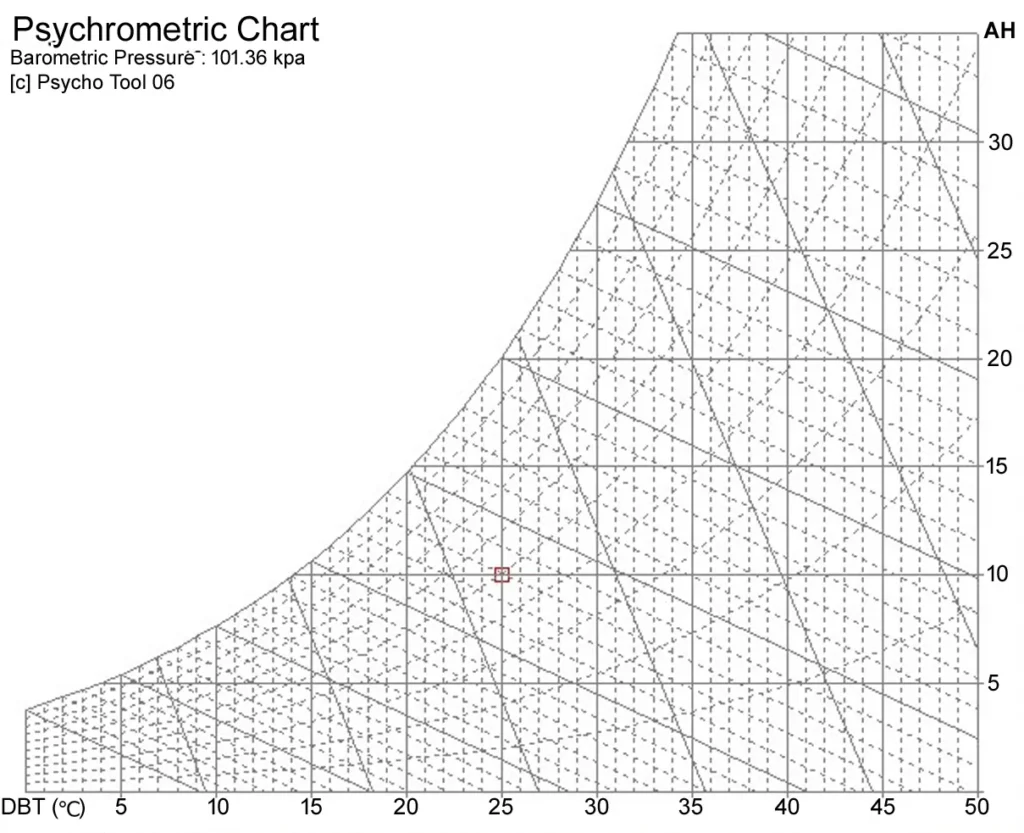
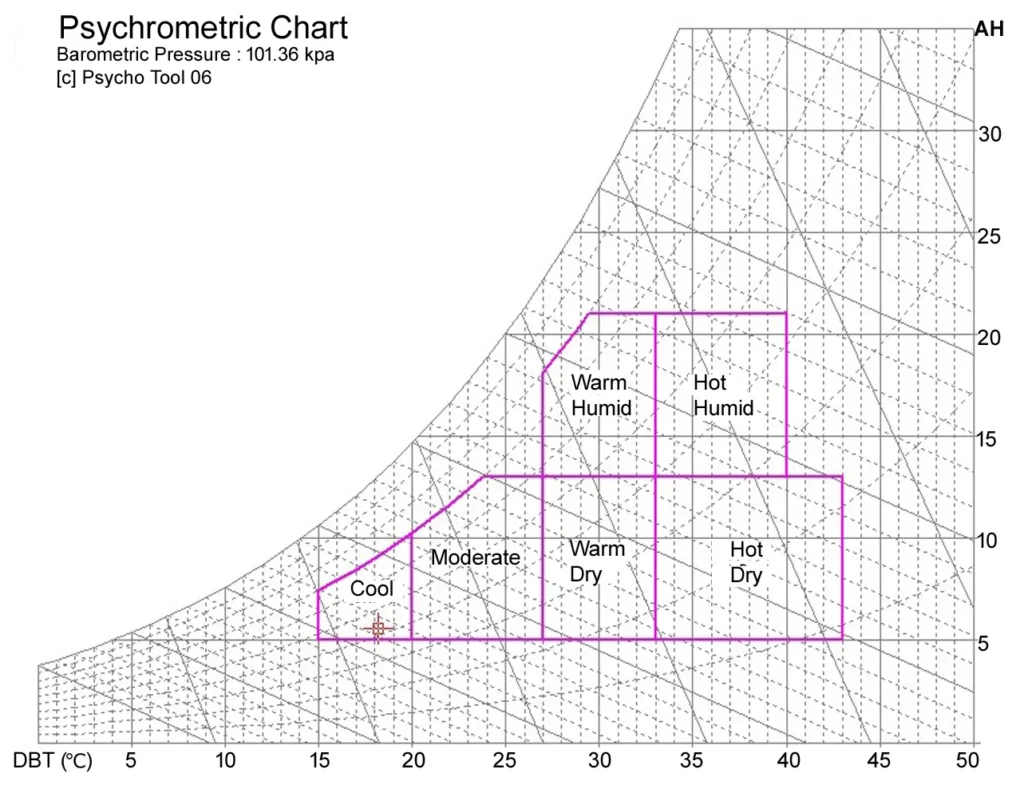
7) Psychrometric Chart
- The Psychrometric Chart provides a graphic representation of the state or condition of the air at any particular time. The chart relates temperature along the horizontal scale to moisture content along the vertical scale.
- At first glance they can look quite complex, like something only an engineer could love.
- However, they are a critical tool in all forms of bio-climatic design and comfort analysis, so it is worthwhile becoming reasonably familiar.
i) Psychrometrics
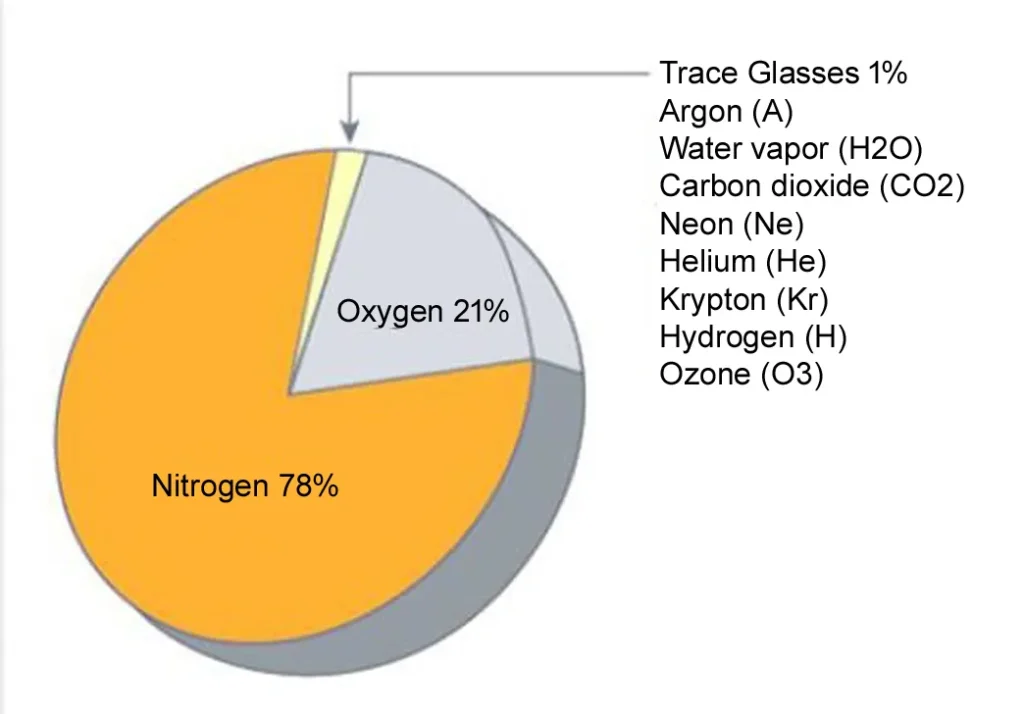
- Air in the atmosphere consists mainly of the gases Nitrogen (N2 -78%), Oxygen (O2-21%), Argon (A- 0.9%) and Carbon Dioxide (CO2 – 0.03%). Under normal atmospheric conditions there is also a certain amount of moisture vapour (H2O) present. This comes from evaporation over the sea, rivers and lakes as well as form the leaves of plants and our own skin when we perspire.
- The amount of moisture vapour in the air varies quite significantly under different conditions. When the air is hot it can contain a large amount of moisture vapour, sometimes as much as 5% by volume. When it is cold, its capacity to hold the moisture as a vapour is reduced.
- When the temperature of warm air begins to fall, the vapour also cools and, if cooling continues, will eventually condense into tiny moisture droplets. In the atmosphere this results in the formation of clouds and eventually rain, whilst it is more commonly manifest as condensation running down the outside of a glass of iced water.
- When condensation is beginning to occur, the air is said to be saturated and cannot hold any more moisture, the point of 100% relative humidity. For a given amount of humidity, the temperature along the X-axis at which this occurs is called the dew point. For a given temperature, the humidity along the Y-axis at which this occurs is called the saturation point.
- The dew point for each temperature in the Psychrometric Chart above is therefore represented by the inner curved boundary. This is because the air simply cannot exist at a state above and to the left of this line. If the air is cooled beyond its dew point, excess vapour is lost as condensation.
ii) Properties of air
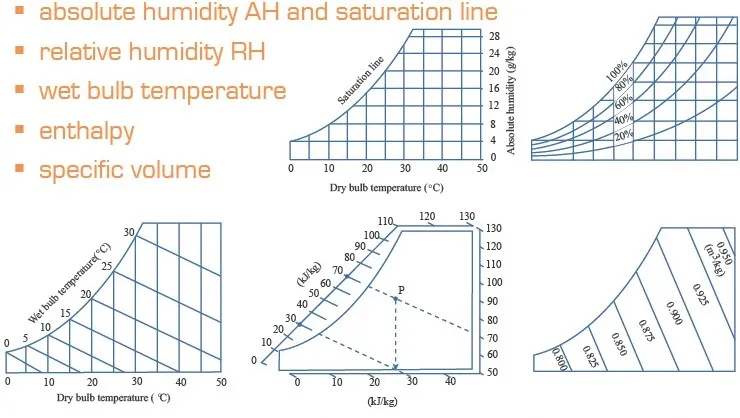
- The following are the important properties of the air described by the Psychrometric Chart:
iii) Dry-bulb temperature (DBT)
- Refers basically to the ambient air temperature.
- It is called dry bulb because it is measured with a standard thermometer whose bulb is not wet – if it were wet, the evaporation of moisture from its surface would affect the reading and give something closer to the wet bulb temperature.
- In weather data terms, dry bulb temperature refers to the outdoor air temperature.
- It is usually given in degrees Celsius (°C) or degrees Faranheight (°F), however its true SI unit is Kelvin (K). On the Kelvin scale 0K equals -273°C.
iv) Wet-bulb Temperature (WBT)
- Relates relative humidity to the ambient air or dry bulb temperature.
- When moisture evaporates, it absorbs heat energy from its environment in order to change phase, thus reducing the temperature slightly.
- WBT varies with relative humidity – if the relative humidity is low and the temperature is high, moisture will evaporate very quickly so its cooling effect will be more significant than if the relative humidity was already high, in which case the evaporation rate would be much lower.
- The difference between the wet bulb and dry bulb temperature therefore gives a measure of atmospheric humidity.
v) Relative Humidity (RH)
- Humidity refers to the amount of moisture vapour in a specific volume of warm air.
- For any particular dry-bulb temperature there is only a certain amount of moisture vapour that can be absorbed in the air before it becomes saturated and precipitation occurs.
- The actual amount of moisture in the air is referred to as the absolute humidity and is measured in g/kg.
- The saturation point or dew point refers to the maximum amount of moisture that the air can hold at a given temperature.
- Relative humidity (RH) is therefore the ratio between the absolute humidity of the air in its current state compared to this maximum amount, expressed as a percentage.
vi) Vapour Pressure (VP)
- When water changes state from a liquid to a gas, as it does when it evaporates into the air, the water molecules in the vapour expand.
- Just as air pressure is directly related to the number of gas molecules per cubic metre of space, so vapour pressure results from the number of water vapour molecular per cubic metre.
- The greater the moisture vapour content of air, the greater the vapour pressure.
- Thus vapour pressure is linearly related to absolute humidity and runs along the same axis of the Psychrometric Chart.
vii) Specific Volume (SpV)
- The specific volume of air is basically the reciprocal of its density.
- As the temperature of the air increases, density will decrease as its molecules vibrate more and take up more space (as per Boyles law). Thus, the specific volume will increase with increasing temperature.
- At one standard atmosphere of pressure and 20°C 50% RH, air has a volume of 0.8402m3/kg. At 30°C 50%RH, the volume will have increased to 0.8774m3/kg.
- This is the basis upon which hot air ballons work, filling the enclosed volume with less dense air than its surroundings.
viii) Enthalpy Values (E)
- Enthalpy is basically the energy content of the air and is given as the sum of both dry bulb temperature (sensible heat) and vaporized moisture content (latent heat).
- Each gram of water vapour represents around 2400 Joules of latent heat energy, enough to raise 1 kilogram of air (just under 1m3) by around 2.4°C (2400/1012).
- Enthalpy is expressed in units of kilojoules per kilogram (kJ/kg) of air and is associated moisture. Air at 0°C and 0% relative humidity is assumed, by convention, to have an enthalpy of 0.0 and is used as the basis for the enthalpy scale.
- Psychrometry is the study of moist air.
- The Psychrometric Chart provides a graphic representation of the full state of the air under any condition.
- This includes all the major climatic indicators, dry-bulb and wet-bulb temperatures, relative and absolute humidity, vapour pressure, air volume and even enthalpy.
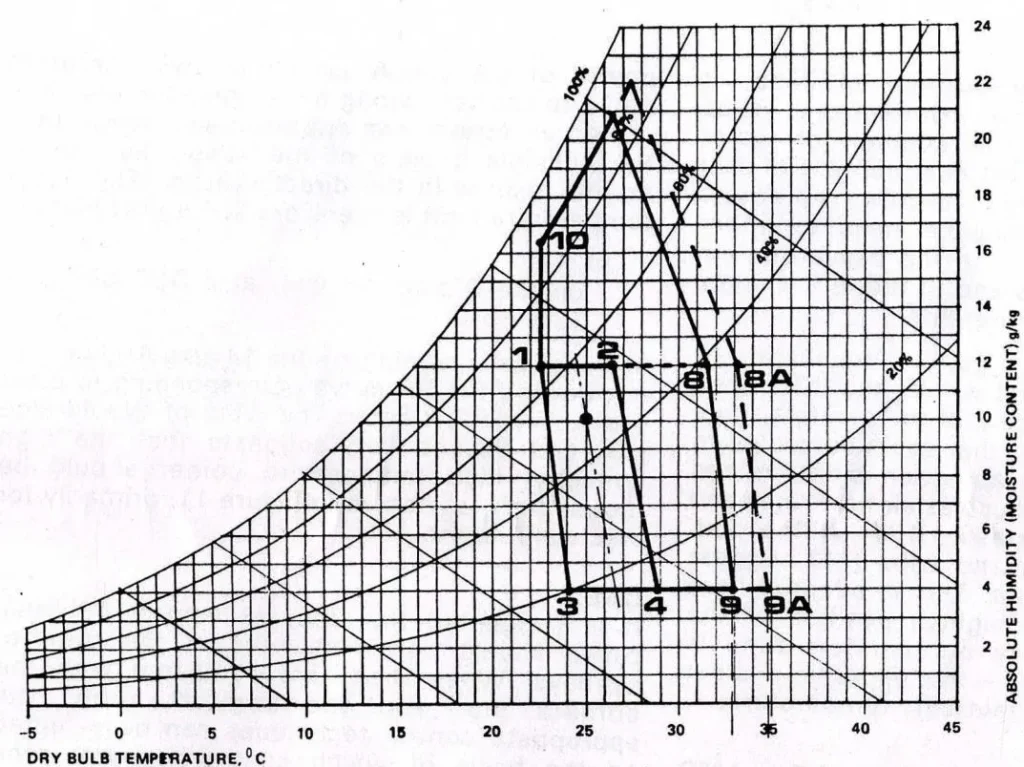
8) Climate analysis
A method which can be used at the pre-design analysis stage for assessing the climate, establishing the thermal control task and selecting the appropriate passive control techniques. The psychrometric chart is used as the basis and the term control-potential zone is used to describe the range of outdoor atmospheric conditions within which indoor comfort could be achieved the various passive control techniques.
- Define the “comfort zone”, i.e., the range of acceptable indoor conditions
- Plot the prevailing climatic conditions and compare these with the comfort zone, in order to ascertain the nature of the climatic problem,
- Show the control-potential zones, i.e., the range of outdoor conditions within which indoor comfort can be achieved by various design and constructional measures (passive controls), such as
- For underheated conditions
- passive solar heating
- For overheated conditions
- Mass effect (thermal inertia)
- Same with night ventilation
- Air movement effect
- Evaporative cooling
- Indirect evaporative cooling
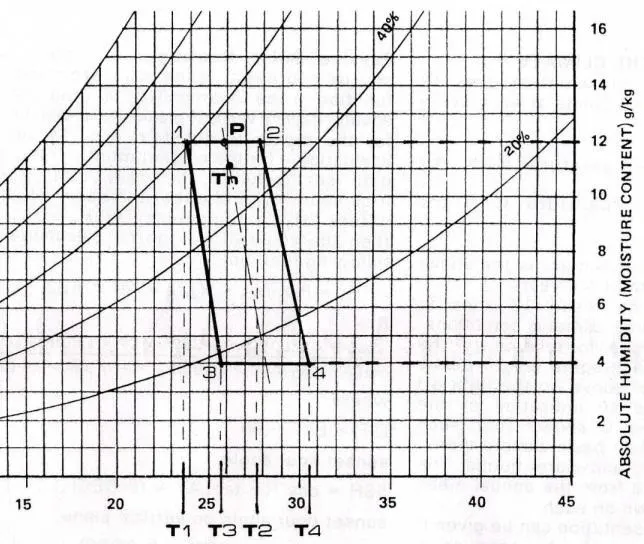
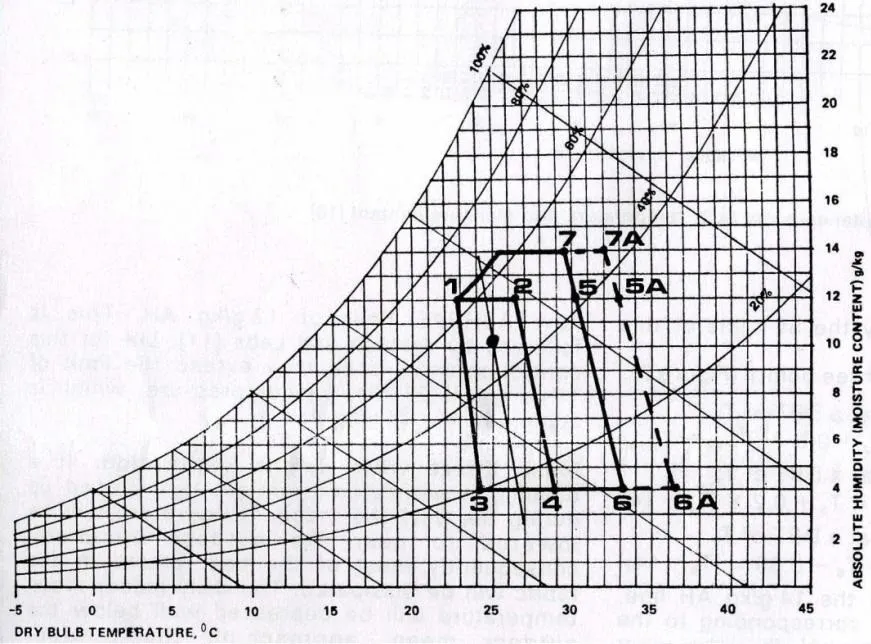
Tn = Thermal neutrality
Ys = Saturation moisture content at Tn
Tp = Tn-[(12-Ys/2) * 0.023 (Tn-14)] ºC
T1 = Tp – 2
T2 = Tp + 2
T3 = T1 + (12-4) * 0.023 (T1-14) = T1 + .2 (T1-14) ºC
T4 = T2 +0.2 (T2 -14) ºC
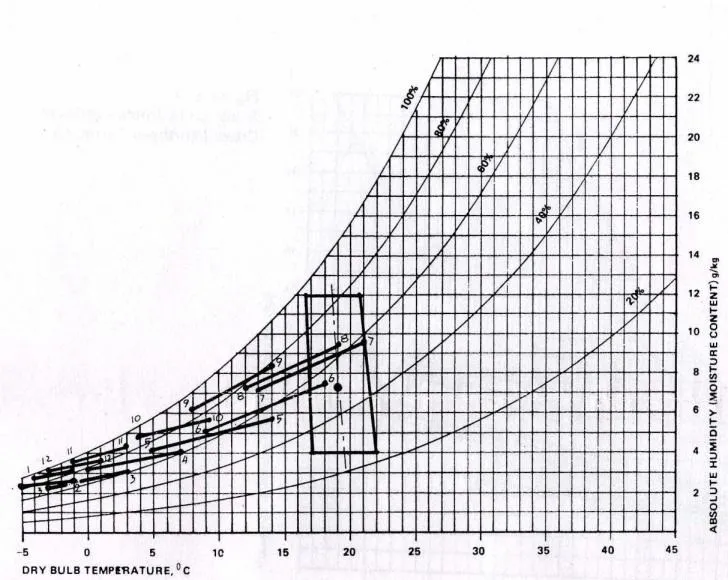
- Represent 12 monthly lines, the two end-points of each being given by
- Mean minimum temperature with morning RH
- Mean maximum temperature with afternoon RH
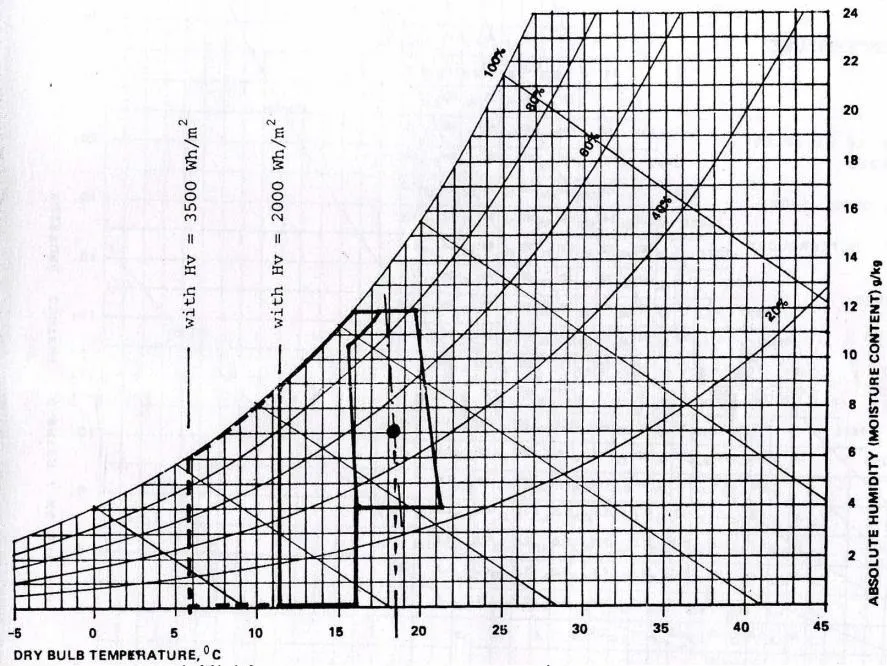
Passive solar heating potential zone
- Hv = 2000 Wh/m2
To = 11.3ºC - Hv = 3500 Wh/m2
To = 5.9ºC
Hv = mean daily total irradiation on an equator facing vertical plane for the coldest month
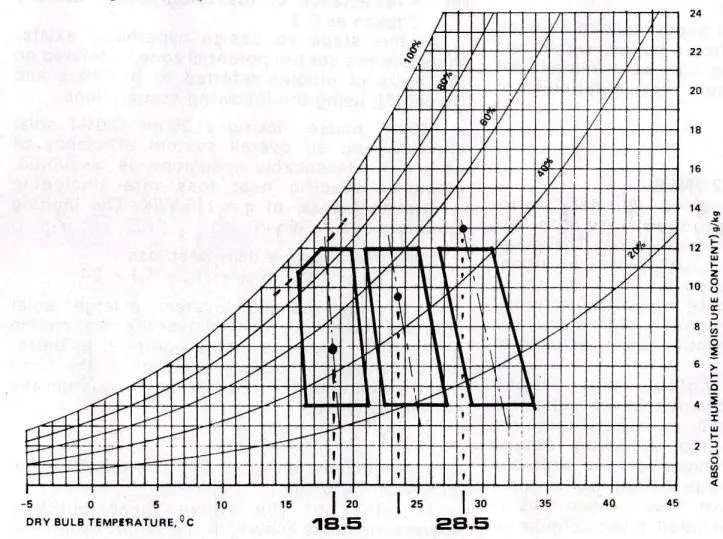
Mass effect control potential zone
- Pt 5 12 g/kg AH = T2 + 0.5 * (Tmax-Tmin)
- Pt 6 4 g/kg AH = T5 + 0.2 * (T5-14)
- Pt 7 14g/kg AH = T5 – 0.05 * (T5-14)
- In cold climate, for continuously occupied building (e.g. a house or a hospital), it would allow the use of intermittent heating and still keep a stable temperature. In an intermittently used and heated building (an office or a school) lightweight (insulated) construction may be better. Massive construction would have a longer heating-up period in the morning and the stored heat would be dissipated overnight, thus wasted.
- The ‘mass effect’ is one of the most important passive control strategies. If there is a storage mass, it can be manipulated according to the climate needs. In a typical hot-dry climate, with a large diurnal variation, where the temperature varies over the daily cycle between too high and too cold (where the day’s mean is within the comfort zone) massive construction provide the full solution, it may ensure comfortable indoor conditions without any mechanical cooling (or night heating).
- The criterion for defining ‘massive, heavyweight’ and a ‘lightweight’ building is given by the specific mass of the building:
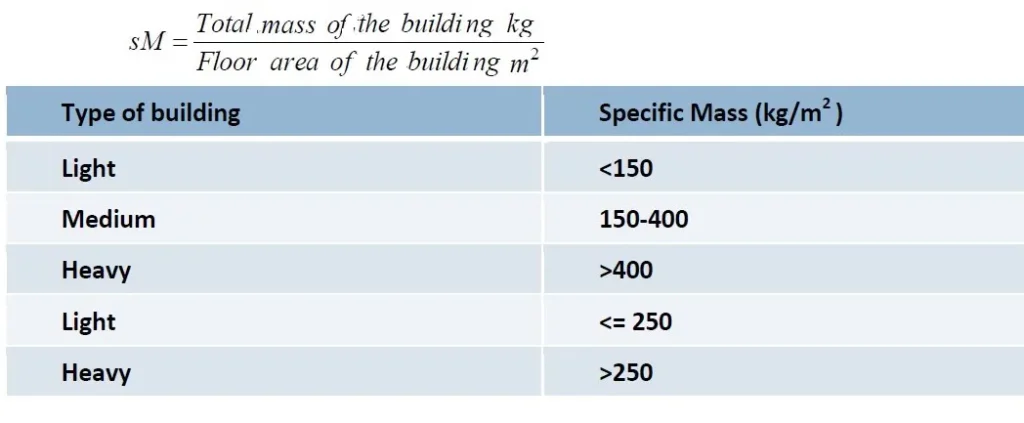
Ventilation effect control potential zone
Understanding the relationship between climate and thermal comfort is critical in designing buildings and communities that are both sustainable and conducive to human health and well-being. By developing energy-efficient buildings that maintain indoor environmental conditions within the appropriate thermal comfort ranges, we can reduce our impact on the natural environment while also improving the quality of life for people who live and work in these spaces.